The histogram shows the brightness distribution, and is employed mainly for checking the exposure of the image.
Using the Histogram
TOPSet the histogram feature to ON.
Set [Main Menu]  [LCD/VF] [Display Settings] [Histogram] to “On”.
You can also press the user button that is assigned with “Histogram”.
Set the upper and lower limits of the histogram display.
After setting, the brightness level is displayed in red color.
|
Item |
Settings |
Options |
|---|---|---|
|
Top |
Sets the maximum brightness limit for changing the histogram display color |
5% to 110% (in 5 % increments) |
|
Bottom |
Sets the minimum brightness limit for changing the histogram display color |
0% to 105% (in 5 % increments) |
 When the upper limit is set to 110% and the lower limit to 0%
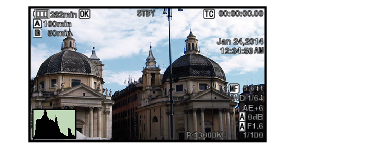
The area in red is not displayed.
When the upper limit is set to 90% and the lower limit to 10%
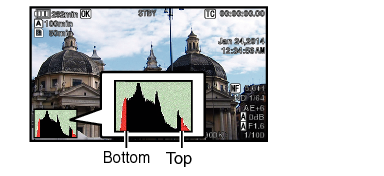
How to read the histogram
The vertical axis denotes the number of pixels.
The horizontal axis denotes the pixel brightness.


